GPU Memory & Profiling
Understanding GPU memory hierarchy and profiling is essential for writing high-performance code. This chapter covers memory transfers, profiling tools, and optimization techniques.
CPU-GPU Memory Model
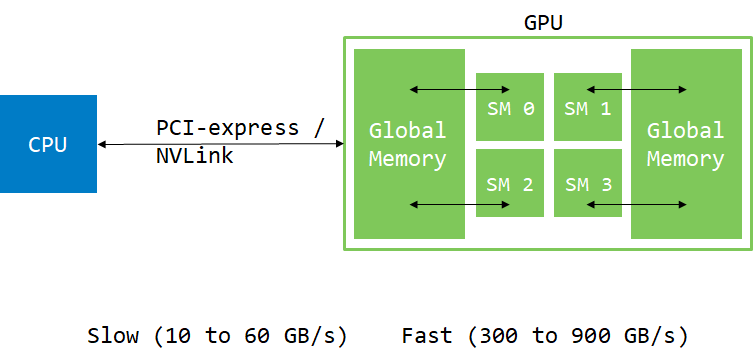
Usually, data comes from the hard drive or network. It has to be moved to the GPU for processing. While GPU can have direct access to system memory (using pinned or managed memory), data still has to move through PCIe or NVLink.
Basic Memory Operations
int main()
{
    const int N = 1024 * 1024 * 32;
    double *h_a, *d_a;
    h_a = new double[N];

    // Allocate memory on device
    cudaMalloc(&d_a, N * sizeof(double));

    // Move memory from host to device
    cudaMemcpy(d_a, h_a, N * sizeof(double), cudaMemcpyHostToDevice);

    // Invoke kernel on device
    add<<<32, 256>>>(d_a, 1.0, N);

    // Copy memory back to host
    cudaMemcpy(h_a, d_a, N * sizeof(double), cudaMemcpyDeviceToHost);

    // Wait for device tasks to complete
    cudaDeviceSynchronize();

    // Use result...
    cudaFree(d_a);
    delete[] h_a;
}
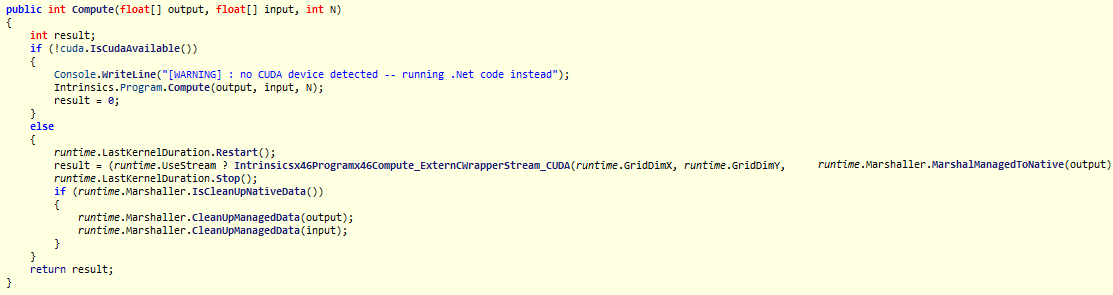
Hybridizer Memory Management
With Hybridizer, memory management is largely automatic:
// Arrays are automatically transferred
wrapper.MyKernel(hostArray, n);
// Results are automatically copied back
Profiling Tools
NVIDIA provides several profiling tools:
| Tool | Description | Best For |
|---|---|---|
| Nsight Systems | System-wide timeline | Overall performance |
| Nsight Compute | Kernel-level analysis | Detailed optimization |
| nvprof (legacy) | Command-line profiler | Quick checks |
Timeline View
The timeline view shows execution flow:
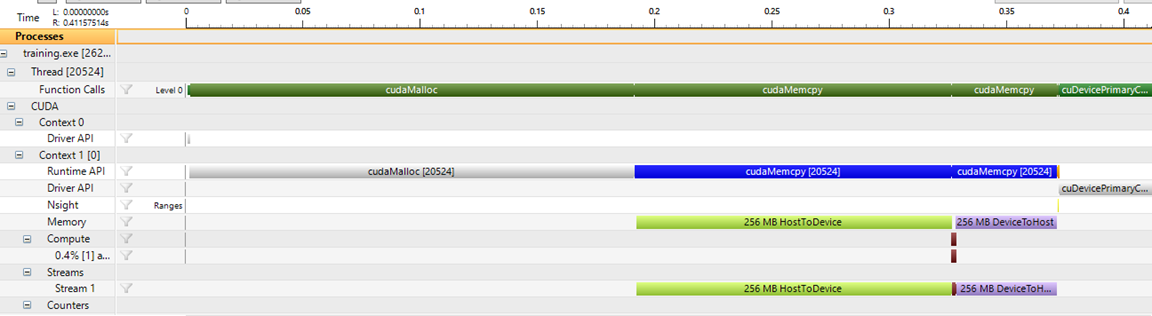
Key observations:
- First
cudaMalloctakes time (CUDA context initialization) - Memory copies (H2D, D2H) often dominate execution time
- Kernel execution (small brown bar) can be very fast
Moving memory is expensive. Minimize transfers as much as possible.
Bandwidth Analysis
The memory tab shows effective bandwidth:
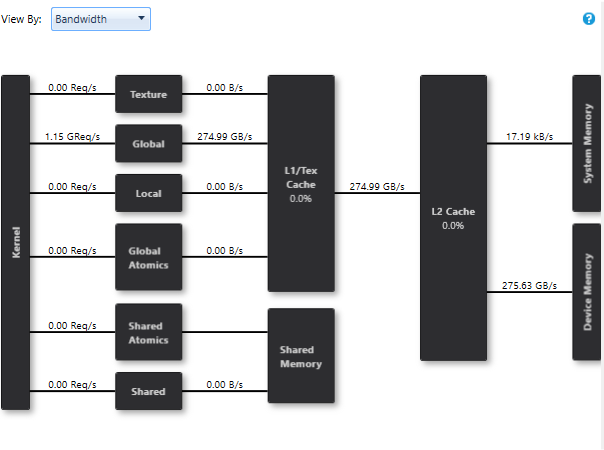
In this example, the kernel achieves 275.63 GB/s (78% of peak on GTX 1080 Ti).
Issue Efficiency
The issue efficiency view reveals optimization opportunities:
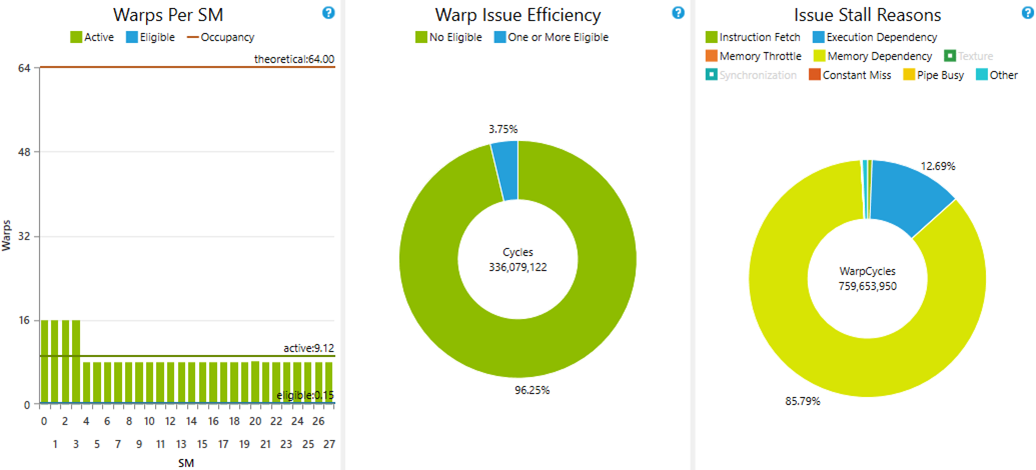
Observations:
- Only 8-16 warps active per SM (limit is 64)
- 85% of time stalled on memory dependency
- Global memory latency is ~400 cycles
Optimizing Occupancy
By increasing the number of blocks, we can saturate the GPU:
cudaDeviceProp prop;
cudaGetDeviceProperties(&prop, 0);
int smCount = prop.multiProcessorCount;

// Launch 8 blocks per SM with 256 threads each
// 8 × 256 = 2048 threads = 64 warps per SM
add<<<8 * smCount, 256>>>(d_a, 1.0, N);
Result with optimal configuration:
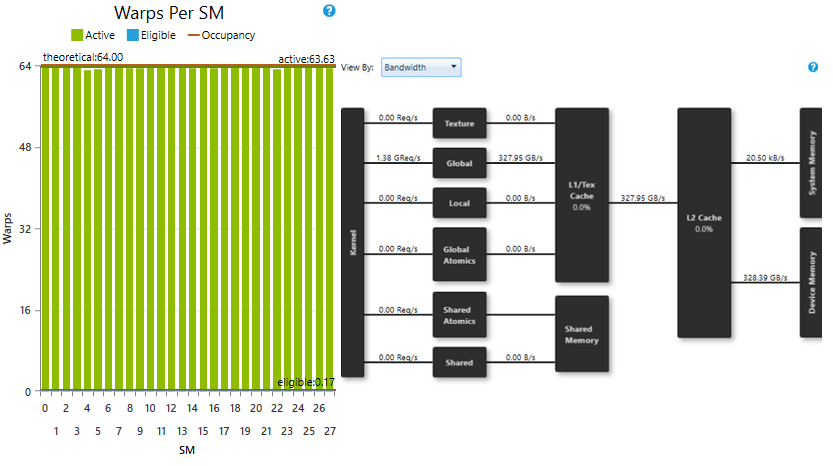
- SMs saturated with enough warps
- Achieved bandwidth: 328.39 GB/s (93% of peak)
Best Practices
| Practice | Impact |
|---|---|
| Minimize host-device transfers | High |
| Use pinned memory for faster transfers | Medium |
| Overlap compute and transfer (streams) | Medium |
| Ensure high occupancy | Medium |
| Optimize memory access patterns | High |
Memory Hierarchy
| Memory Type | Scope | Speed | Size |
|---|---|---|---|
| Registers | Thread | Fastest | Limited |
| Shared Memory | Block | Very Fast | 48-96 KB |
| L1 Cache | SM | Fast | 48-128 KB |
| L2 Cache | Device | Medium | 4-40 MB |
| Global Memory | Device | Slow | 8-80 GB |
Next Steps
- Performance Metrics — Understanding key metrics
- CUDA Functions — Writing efficient kernels
- Data Marshalling — Hybridizer memory management